Background
Much of my postdoctoral research is focused on studying (and building tools to help decision makers mitigate) the impacts of climate change on communities in North Carolina. I’m also committed to reducing my carbon footprint and have read over and over that flying makes up the largest fraction of an average person’s carbon dioxide emissions. In early January I decided that I wanted to try to reduce the number of flights I took in 2019. I also wanted to figure out how to offset the cost of my carbon dioxide emissions when it was going to be tough to avoid flying.
I started researching websites to help me figure out how much to offset. I found several tools to calculate carbon dioxide emissions (e.g., here and here) but couldn’t find any that told me how much to donate based on these emissions. Early on, I decided my offsets would go to a local organization addressing climate change. For me this looked like a non-profit focused on building solar panels in the Raleigh-Durham area, but for you, it might be something different. I was doing these calculations manually and then I realized it would be more fun and more efficient to automate them in R!
In this post, I’m starting with flights but maybe I’ll branch out to driving in the future…and maybe someday a shiny app for both.
NOTE! If you’re not an R-user but you’d still like to learn how much you should donate to offset the carbon dioxide you emit from flying, please scroll to the bottom of this post. I’ve included step-by-step directions for how to do this without R.
Goals of This Post
The main goals of this post are to:
Calculate how much carbon dioxide is emitted for flights
Calculate how much to donate based on this carbon footprint
Write a function to automate these calculations
Thanks to friends for their encouragement and to the #fridaysforthefuture movement for inspiring this post.
Set Up
Let’s load the library we’ll need for this post. We’ll use the airportr package, which has helpful functions for looking up airport codes and calculating the distances between airports.
library(airportr)All the Airports
There are many airports around the world and you might not know the 3-letter International Air Transport Association (IATA) code for the airports. Luckily, the airportr package has a look-up table function to help with this.
In this example, let’s calculate the amount we can donate to offset the carbon dioxide emissions for a flight from Raleigh/Durham, NC (departure city) to Charlotte, NC (arrival city).
Let’s start by looking up airports with “Raleigh” in their name.
airport_lookup(input = "Raleigh", input_type = "name", output_type = "IATA")## Warning in airport_lookup(input = "Raleigh", input_type = "name", output_type =
## "IATA"): No exact matches but some similar names in the database include:## General Ignacio P. Garcia International Airport
## Licenciado y General Ignacio Lopez Rayon Airport
## Rabigh Airport
## Raleigh Durham International Airport
## Raleigh County Memorial Airport
## Leigh Creek AirportThere were several results but the Raleigh Durham International Airport is the one we want. Let’s use that as the new look-up function input.
airport_lookup(input = "Raleigh Durham International Airport", input_type = "name", output_type = "IATA")## [1] "RDU"This time we get get the 3-digit IATA code for our departure city: RDU.
If you think you know the 3-digit IATA code for your airport of interests, you can also use the look-up functions to double check. Let’s do this for the arrival city, which I’m pretty sure is CLT.
airport_lookup(input = "CLT")## [1] "Charlotte Douglas International Airport"Great! Looks like CLT was a good guess for for the Charlotte, NC airport.
Calculate the Distance Between Airports
Now that we know the departure and arrival city IATA codes, we can use them to calculate the distance between RDU and CLT. The airportr package also has a function for this.
kilometers <- round(airport_distance("RDU", "CLT"))
miles <- round(airport_distance("RDU", "CLT") * 0.621)

kilometers
## [1] 209miles## [1] 130There are 209 km (or 130 mi) between the RDU and CLT airports (as a crow flies).
Carbon Dioxide Emission Calculations
To calculate our carbon dioxide emissions we’ll need to know how much carbon dioxide is emitted per mile traveled per person. Thankfully, many people before me have worked out this calculation. One of the most thorough descriptions of this is available at blueskymodel.org. After stepping through their calculations, this website recommends that 1 air mile produces 0.24 pounds of carbon dioxide emitted per person.
Radiative forcing is important to consider with respect to flight emissions calculations because it allows us to account for the fact that our plane is closer to the top of the atmosphere when it is admitting carbon dioxide. This matters because carbon dioxide emitted higher up in the Earth’s atmosphere has a greater warming potential then carbon dioxide emitted by our cars, etc. on the Earth’s surface. To account for radiative forcing, we can multiply our emission calculation by a factor. The website carbonfund.org recommends this factor be equal to 1.891.
The full calculation for metric tons of carbon oxide emitted with radiative forcing is given below. The (1/2204.62) helps us convert from pounds to metric tons.
num_people <- 1
co2_emitted <- miles * num_people * 0.24 * (1 / 2204.62) * 1.891

round(co2_emitted, 3)
## [1] 0.027When one person travels one-way from RDU to CLT, they emit 0.027 metric tons (or 59 pounds) of carbon dioxide.
Carbon Dioxcide Offset Calculations
Next, we’ll need to figure out how much to donate given these carbon dioxide emissions. To do this, we can refer to the US Environmental Protection Agency’s (USEPA) Social Cost of Carbon Technical Report. The information we’ll need is found in Table 2 of this document. We can save this information to a dataframe. The social cost of carbon includes the impact of carbon dioxide emissions on: “…changes in net agricultural productivity, human health, property damages from increased flood risk, and changes in energy system costs, such as reduced costs for heating and increased costs for air conditioning.” (USEPA, 2017).
social_cost_co2 <- data.frame(
  year = seq(2015, 2050, 5),
  avg_5_perc_usd_per_ton_co2 = c(11, 12, 14, 16, 18, 21, 23, 26),
  avg_3_perc_usd_per_ton_co2 = c(36, 42, 46, 50, 55, 60, 64, 69),
  avg_2.5_perc_usd_per_ton_co2 = c(56, 62, 68, 73, 78, 84, 89, 95),
  high_impact_usd_per_ton_co2 = c(105, 123, 138, 152, 168, 183, 197, 212)
)
Let’s walk through each of these columns. Column 1 is the year, which ranges from 2015 to 2050. Columns 2 to 5 all represent the cost (in US dollars) of emitting a metric ton of carbon dioxide given different future strategies. That is, the average (of three climate models times five climate change scenarios) cost given a 5%, 3%, and 2.5% discount rate for columns 2 through 4, respectively. I’ll admit that I don’t fully understand the discount rate, but believe it’s used as a way to consider whether people are more likely to value short-term or long-term risks associated with climate change. The larger the discount rate, the less they value long-term risk. In a societal context, the larger discount rate suggests that current generations are valued more than future generations. The report also includes a high impact case that is calculated from the 95th percentile (of three climate models times five climate change scenarios), rather than the average, cost given a 3% discount rate. The USEPA’s Social Cost of Carbon Technical Report report says, “…there is extensive evidence in the scientific and economic literature of the potential for lower-probability, higher-impact outcomes from climate change, which would be particularly harmful to society and thus relevant to the public and policymakers.” Therefore, for this blog post, we’ll move forward using the high impact case.
We can fit this linear trend and use it to estimate the cost of a metric ton of carbon dioxide emitted for years not in Table 2 (i.e., for this year, 2019).
# fit a linear model
cost_lm <- lm(high_impact_usd_per_ton_co2 ~ year, data = social_cost_co2)

# save the model parameters for prediction
intercept <- cost_lm$coefficients[1]
slope <- cost_lm$coefficients[2]
Let’s plot the data (points) and linear model (line).
plot(high_impact_usd_per_ton_co2 ~ year, data = social_cost_co2, pch = 16, xlab = "Year", ylab = "Cost per Metric Ton CO2 Emitted (USD)")
abline(a = intercept, b = slope, col = "red", lwd = 3)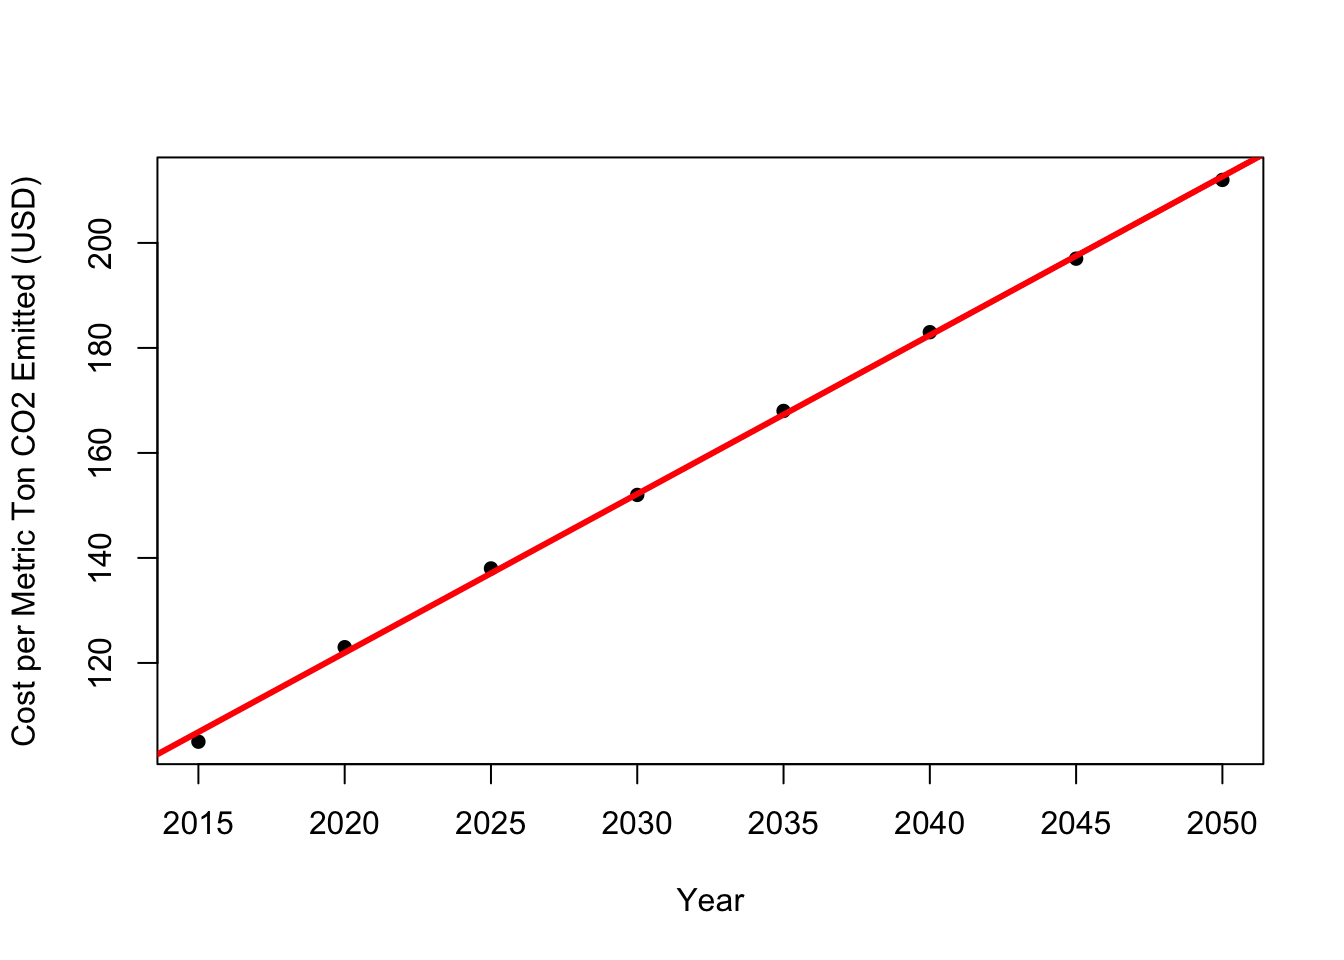
Ok, now we can use the model parameters to predict the cost for a given year. Let’s try this for 2019.
my_year <- 2019
my_year * slope + intercept
## year
## 118.9286The social cost of a metric ton of carbon dioxide emitted in 2019 is $119.
Putting it All Together (aka Making an R Function)
Now let’s take all the code we wrote above and combine it into a custom R function that calculates how much we can donate to offset the carbon dioxide emissions for a new flight. In this second example, we’ll fly round-trip from Raleigh/Durham, NC (departure city) to San Francisco, CA (arrival city).
carbon_offset_cost <- function(departing_airport_code, arriving_airport_code, year, num_people, radiative_force = TRUE, round_trip = FALSE) {
  # year should range from 2015 - 2050 to assume linearity
  # departing_airport_code and arriving_airport code are three letter airport codes
  # radiative_force = TRUE (default) will use radiative forcing in the calculation
  # set to FALSE to avoid using radiative forcing
  # round_trip = FALSE (default) will double the cost calculation if set to TRUE
  # carbon offset result is given in USD

  # note: you will need to load the airportr package before using this function

  # linear coefficients from high impact column of table 2
  # source: https://19january2017snapshot.epa.gov/sites/production/files/2016-12/documents/sc_co2_tsd_august_2016.pdf
  intercept <- (-5986.143)
  slope <- 3.02381

  # calculate miles flown
  miles <- round(airport_distance(departing_airport_code, arriving_airport_code) * 0.621)

  if (radiative_force == TRUE) {
    # metric tons of co2 emitted w/ radiative forcing
    co2_emitted <- miles * num_people * 0.24 * (1 / 2204.62) * 1.891
    # source: https://blueskymodel.org/air-mile (for emission conversion factor per person)
    # source: https://carbonfund.org/how-we-calculate/ (for carbon forcing coefficient)

    # cost in usd
    if (round_trip == FALSE) {
      # one-way
      cost <- co2_emitted * (slope * year + intercept)
    }

    else if (round_trip == TRUE) {
      # round-trip
      cost <- co2_emitted * (slope * year + intercept) * 2
    }
  }

  else if (radiative_force == FALSE) {
    # metric tons of co2 emitted w/out radiative forcing
    co2_emitted <- miles * num_people * 0.24 * (1 / 2204.62)

    # cost in usd
    if (round_trip == FALSE) {
      # one-way
      cost <- co2_emitted * (slope * year + intercept)
    }

    else if (round_trip == TRUE) {
      # round-trip
      cost <- co2_emitted * (slope * year + intercept) * 2
    }
  }

  else {
    cost <- NA
  }

  return(cost)
}
Now let’s test out the function for a round-trip flight from RDU to SFO (for 1 person).
carbon_offset_cost(departing_airport_code = "RDU",
                   arriving_airport_code = "SFO",
                   year = 2019,
                   num_people = 1,
                   radiative_force = TRUE,
                   round_trip = TRUE)
## [1] 117.2229Looks like we can donate $117 to ofset the carbon dioxide emitted from our round-trip flight from RDU to SFO in 2019. If we want to be more generous we can adjust the year for a future period. For example, if we change the year to the maximum value, 2050, we can donate $210. Our emissions are more expensive the further out in time we go (see the USEPA Social Cost of Carbon website for more information).
Some other thoughts that I wanted to mention before signing off:
Unless you’re an R user, I recognize that it will take extra work for you to figure out how much you should donate to offset your flight’s carbon dioxide emissions. The first task is for me to start writing a second post for non-R users, and in the mean time, I’ll give an example below to put this all into perspective for non-R users.
What if I’m not an R user?
Here are some of the basic calculations you’d need to make if you are not an R user and want to calculate your carbon foot print for a flight you’re taking.
Steps:
1. Determine the mileage between your arrival and destination airports in miles (i.e., jot this down as variable miles). Use a website like this.
2. Decide how many people (i.e., jot this down as variable num_people) are traveling and whether the trip is a round-trip or one way.
3. If a one-way trip, use the formula: co2_emitted = miles x num_people x 0.24 x (1 / 2204.62) x 1.891 to determine the metric tons of carbon dioxide emitted from your flight. Don’t forget the order of operations here. ;) The variable miles comes from step 1 and the variable num_people comes from step 2. If round-trip, calculate co2_emitted as mentioned previously and multiply this by 2 since you’re traveling to your destination and back.
4. Think about whether you view climate change as a short- or long-term goal. If you think of it based on short-term impacts only then choose the current year (i.e., jot this down as variable year = 2019). However, if you are commited to addressing its more long-term impacts, you can choose any year up until 2050 (i.e. jot this down as variable year = 2050). The closer to 2050 you choose, the larger your donation will be.
5. Calculate the cost of your offset (i.e., how much you’ll donate) using the formula: cost = co2_emitted x (3.02 x year - 5986.1). Remember your order of operations. The variable co2_emitted comes from step 3 and the variable year comes from step 4.
6. Donate this amount (in US dollars) to your local climate change organization (e.g., one building solar panels, planting trees, or advocating for bicycle lanes).
If have questions, comments, or ideas related to this post, please let me know!